Basics of Biochemical Techniques
Biochemical techniques form the backbone of modern biological research, providing scientists with powerful tools to investigate the molecular intricacies of life. These methods allow researchers to isolate, analyze, and manipulate biological molecules such as proteins, nucleic acids, lipids, and carbohydrates. Understanding these techniques is crucial for anyone entering the fields of biochemistry, molecular biology, or biotechnology.
In this comprehensive guide, we will explore the fundamental principles and applications of various biochemical techniques. From spectroscopy to immunological assays, we’ll cover the essential methods that drive discoveries in the life sciences. Whether you’re a student, researcher, or science enthusiast, this article will provide you with a solid foundation in the basics of biochemical techniques.
A. Spectroscopy
Spectroscopy is a powerful analytical technique that measures the interaction between matter and electromagnetic radiation. In biochemistry, spectroscopic methods are widely used to study the structure, function, and dynamics of biological molecules.
1. UV-Visible Spectroscopy
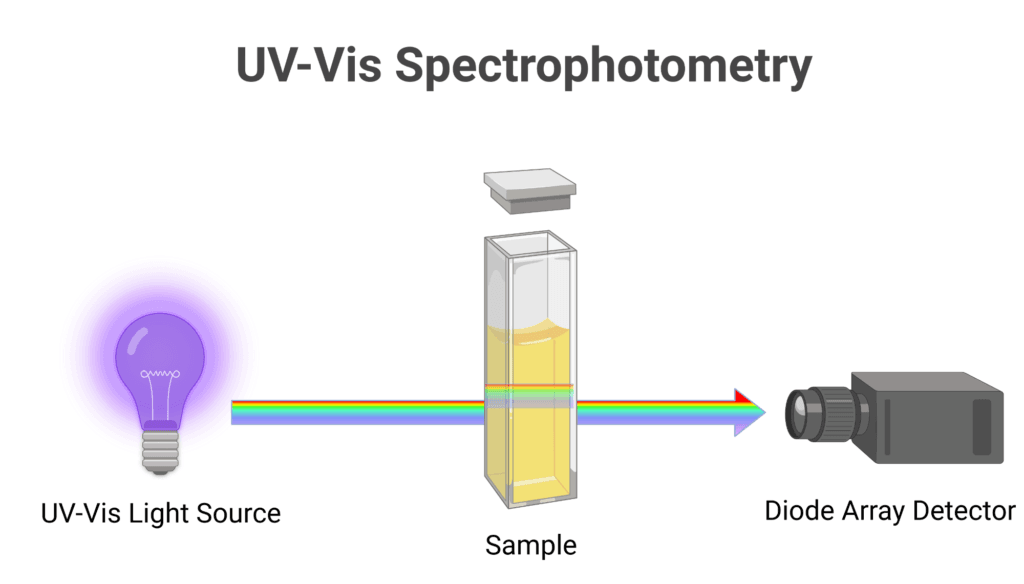
UV-visible spectroscopy is one of the most commonly used spectroscopic techniques in biochemistry. It involves measuring the absorption of light by molecules in the ultraviolet and visible regions of the electromagnetic spectrum.
Key applications include:
- Quantification of nucleic acids and proteins
- Monitoring enzyme reactions
- Determining protein concentration using the Bradford assay
2. Fluorescence Spectroscopy
Fluorescence spectroscopy utilizes the phenomenon of fluorescence, where molecules emit light after absorbing photons of a specific wavelength. This technique is highly sensitive and widely used in biochemical research.
Applications of fluorescence spectroscopy include:
- Studying protein folding and conformational changes
- Investigating protein-ligand interactions
- Fluorescence microscopy for cellular imaging
3. Infrared (IR) Spectroscopy
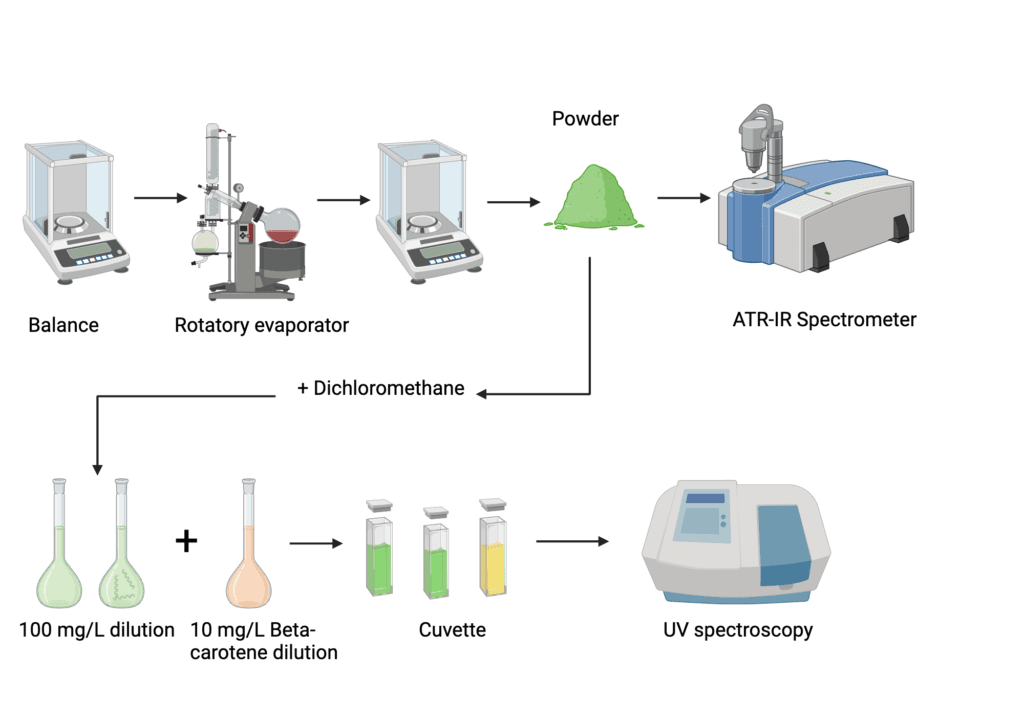
IR spectroscopy measures the absorption of infrared radiation by molecules, providing information about their chemical bonds and functional groups. In biochemistry, it’s particularly useful for studying the secondary structure of proteins.
Key applications of IR spectroscopy in biochemistry include:
- Analyzing protein secondary structure (α-helices, β-sheets)
- Investigating lipid membrane composition
- Studying carbohydrate structures
4. Nuclear Magnetic Resonance (NMR) Spectroscopy
NMR spectroscopy is a powerful technique that provides detailed information about the structure and dynamics of molecules at the atomic level. It’s based on the magnetic properties of certain atomic nuclei, such as hydrogen (1H) and carbon-13 (13C).
Applications of NMR in biochemistry include:
- Determining the three-dimensional structure of proteins and nucleic acids
- Studying protein-ligand interactions
- Investigating metabolomics and metabolic pathways
B. Chromatography
Chromatography is a versatile separation technique used to isolate and purify individual components from complex mixtures. It relies on the differential distribution of molecules between a stationary phase and a mobile phase.
1. High-Performance Liquid Chromatography (HPLC)
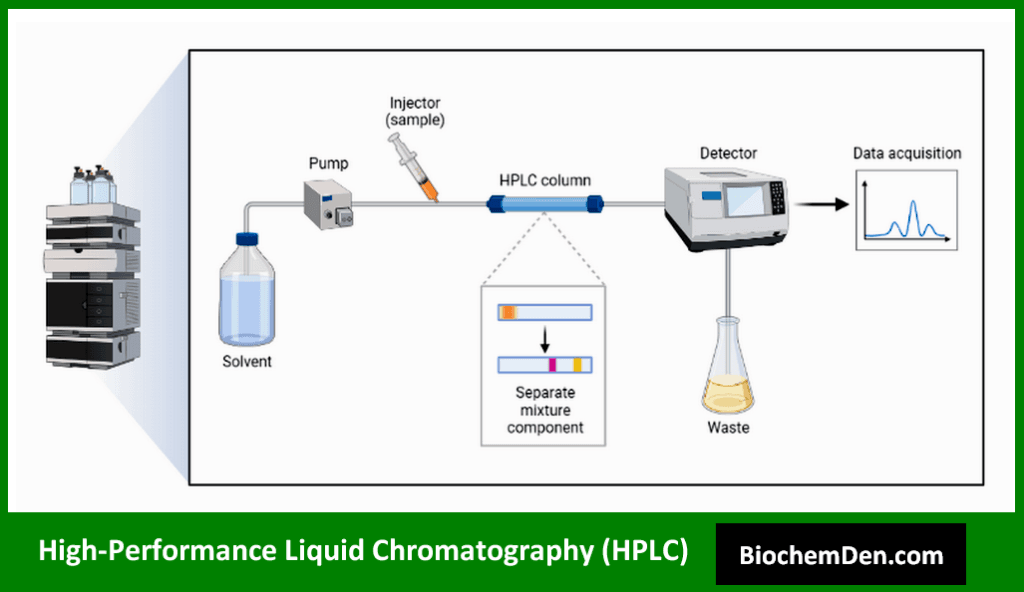
HPLC is a powerful chromatographic technique that uses high pressure to force a liquid mobile phase through a column packed with a stationary phase. It offers high resolution and sensitivity for separating and analyzing a wide range of biomolecules.
Key applications of HPLC in biochemistry include:
- Purification of proteins and peptides
- Analysis of small molecules and metabolites
- Quality control in pharmaceutical and food industries
2. Gas Chromatography (GC)
Gas chromatography is used to separate and analyze volatile compounds. In this technique, the mobile phase is a gas, typically helium or nitrogen, which carries the sample through a column containing a stationary phase.
Applications of GC in biochemistry include:
- Analysis of fatty acids and lipids
- Metabolite profiling in metabolomics studies
- Detection of environmental contaminants
3. Affinity Chromatography
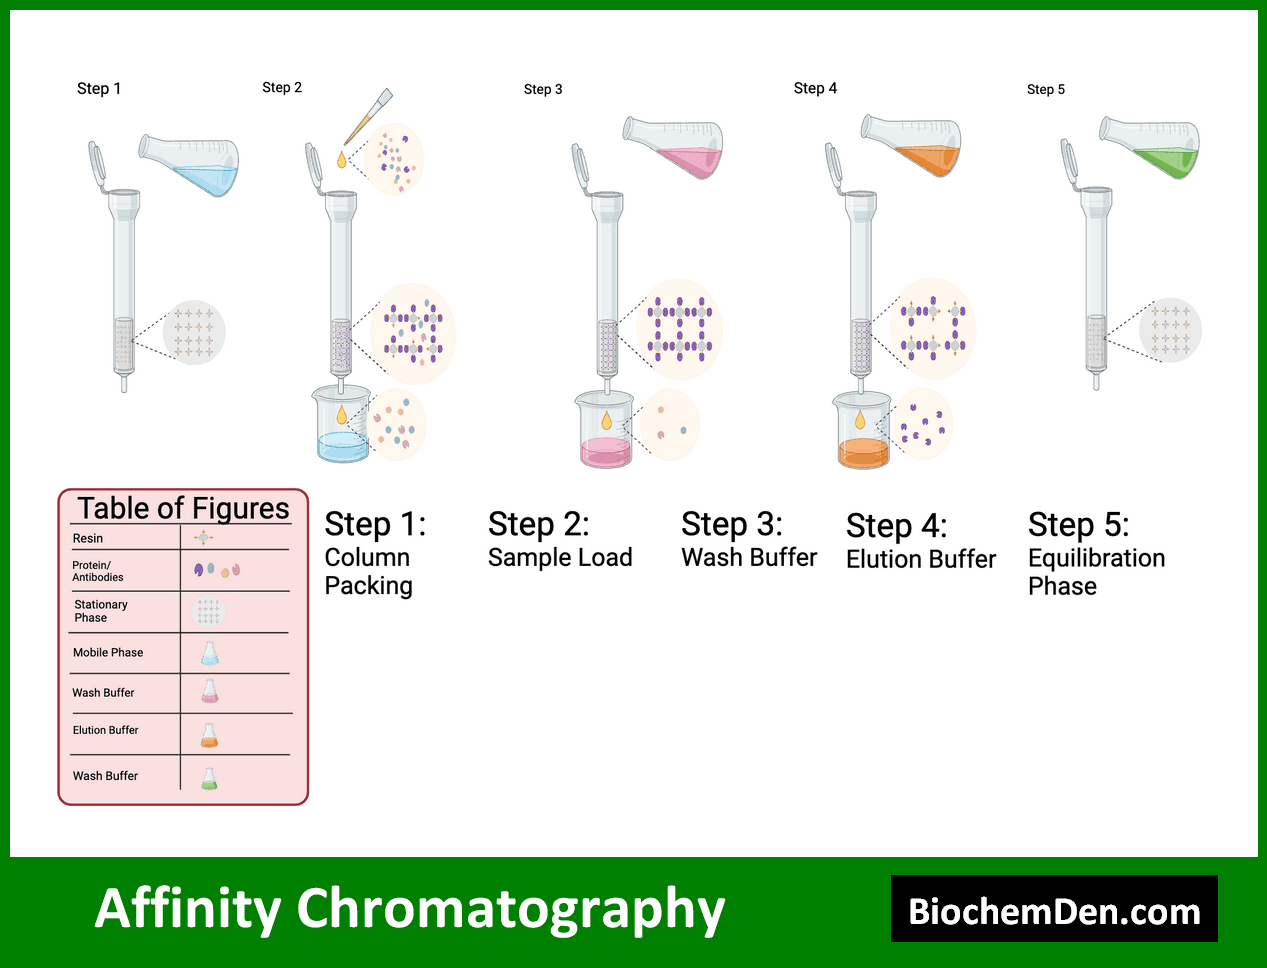
Affinity chromatography is a highly specific separation technique based on the reversible interaction between a target molecule and a ligand immobilized on a solid support. This method is particularly useful for purifying proteins and other biomolecules.
Key applications of affinity chromatography include:
- Purification of recombinant proteins using His-tag systems
- Isolation of antibodies using protein A or G columns
- Enrichment of phosphorylated proteins using metal affinity chromatography
C. Electrophoresis
Electrophoresis is a separation technique that uses an electric field to separate molecules based on their size and electrical charge. It’s widely used in biochemistry for analyzing proteins, nucleic acids, and other charged biomolecules.
1. Polyacrylamide Gel Electrophoresis (PAGE)
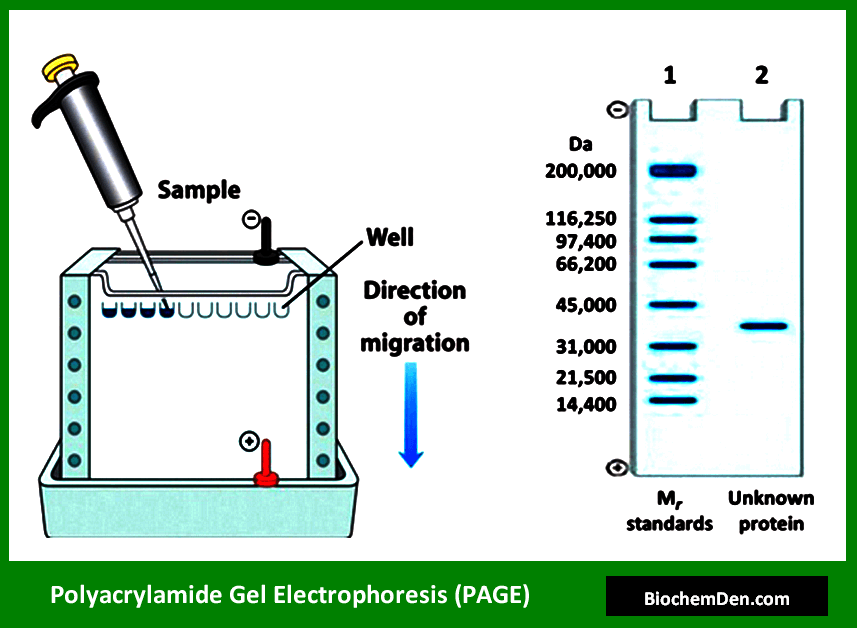
PAGE is a versatile electrophoretic technique used primarily for separating proteins. It utilizes a polyacrylamide gel as the separation matrix, which acts as a molecular sieve.
Key variants and applications of PAGE include:
- SDS-PAGE for separating proteins based on molecular weight
- Native PAGE for analyzing protein complexes and maintaining protein-protein interactions
- Two-dimensional gel electrophoresis for proteomics studies
2. Agarose Gel Electrophoresis
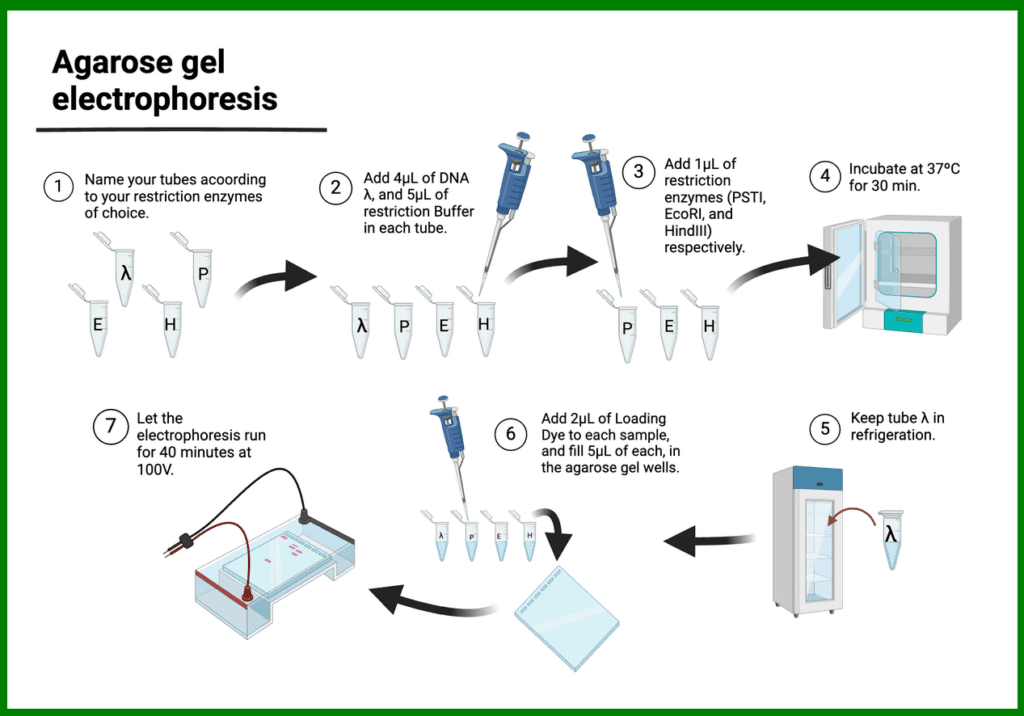
Agarose gel electrophoresis is commonly used for separating nucleic acids, such as DNA and RNA. The agarose gel forms a porous matrix that allows for the separation of nucleic acid fragments based on their size.
Applications of agarose gel electrophoresis include:
- Analyzing PCR products
- Restriction enzyme digestion analysis
- Isolating specific DNA fragments for cloning
3. Capillary Electrophoresis
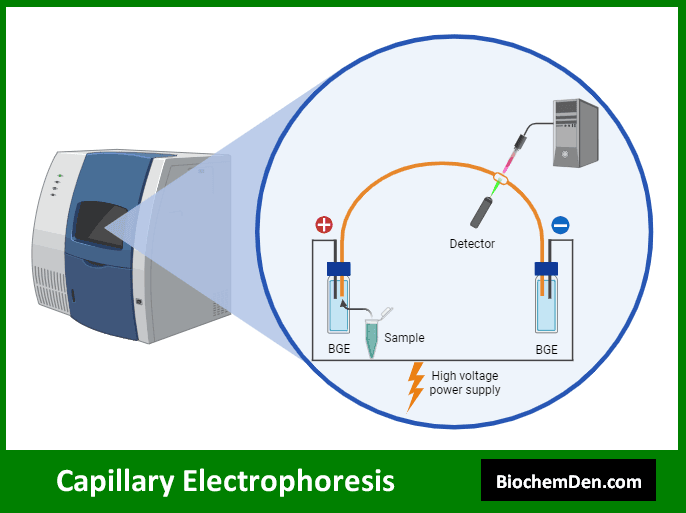
Capillary electrophoresis is a high-resolution separation technique that uses a narrow capillary tube filled with an electrolyte solution. It offers rapid analysis and high efficiency for separating various biomolecules.
Key applications of capillary electrophoresis in biochemistry include:
- DNA sequencing
- Protein analysis, including isoform separation
- Analysis of small molecules and metabolites
D. Centrifugation
Centrifugation is a fundamental technique in biochemistry used to separate particles based on their size, shape, and density. It employs centrifugal force to sediment particles in a liquid medium.
1. Differential Centrifugation
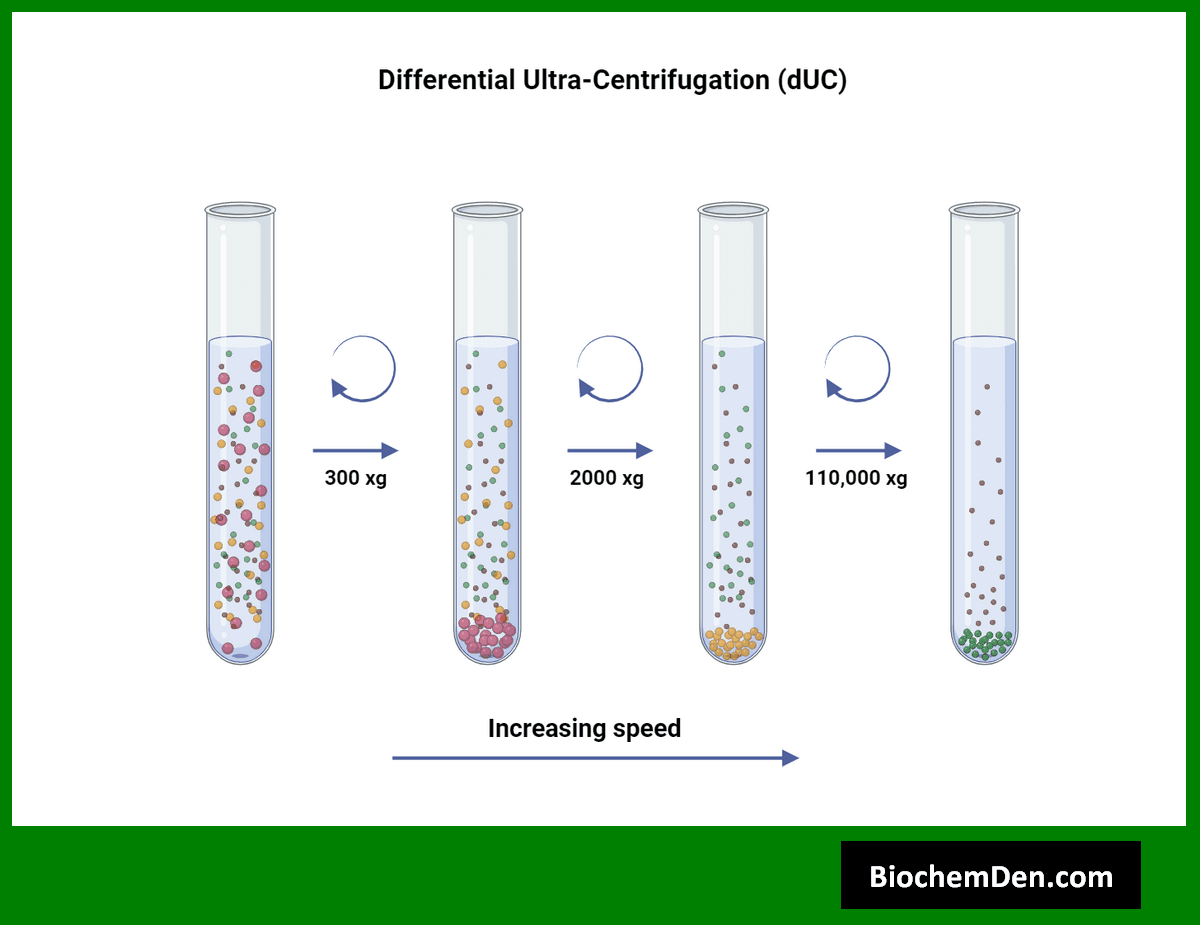
Differential centrifugation is a method used to separate cellular components based on their sedimentation rates. It involves a series of centrifugation steps at increasing speeds to isolate different cellular fractions.
Applications of differential centrifugation include:
- Isolation of organelles such as mitochondria, chloroplasts, and nuclei
- Separation of cellular debris from homogenates
- Fractionation of bacterial cell components
2. Density Gradient Centrifugation
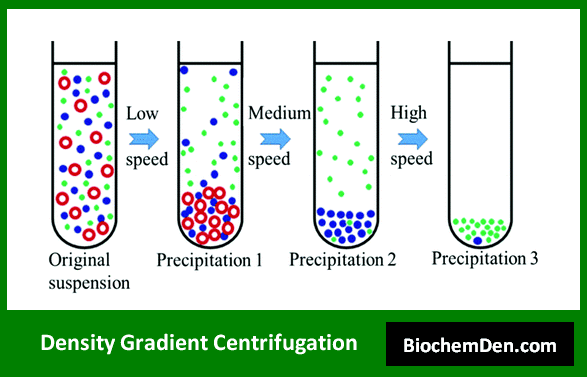
Density gradient centrifugation uses a pre-formed density gradient medium, such as sucrose or cesium chloride, to separate particles based on their buoyant density. This technique offers higher resolution than differential centrifugation.
Key applications of density gradient centrifugation include:
- Purification of viruses and subcellular organelles
- Isolation of plasmid DNA
- Separation of lipoprotein particles
3. Ultracentrifugation
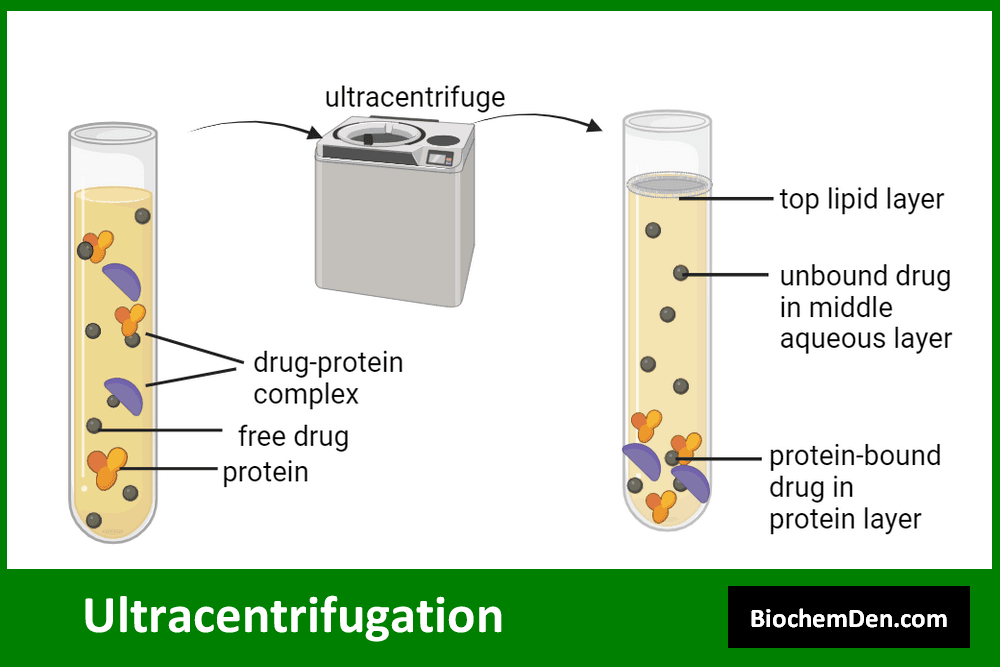
Ultracentrifugation employs extremely high centrifugal forces to separate macromolecules and small particles. It’s particularly useful for studying the properties of proteins and nucleic acids.
Applications of ultracentrifugation in biochemistry include:
- Determining the molecular weight of proteins
- Studying protein-protein interactions
- Analyzing the composition of lipoproteins
E. Microscopy
Microscopy techniques are essential for visualizing cellular structures and biomolecules at high resolution. Advanced microscopy methods have revolutionized our understanding of cellular processes and molecular interactions.
1. Light Microscopy
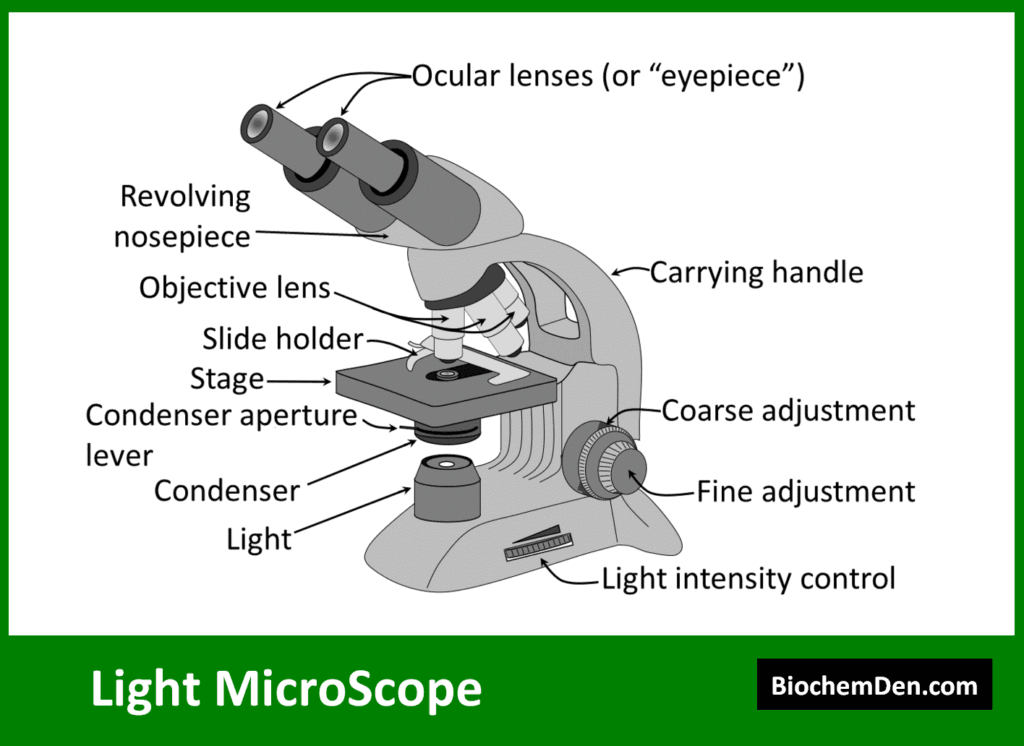
Light microscopy uses visible light to magnify specimens. While basic light microscopy has limited resolution, advanced techniques have greatly expanded its capabilities.
Key light microscopy techniques in biochemistry include:
- Phase contrast microscopy for observing living cells
- Differential interference contrast (DIC) microscopy for enhancing contrast in unstained samples
- Fluorescence microscopy for visualizing specific molecules using fluorescent labels
2. Electron Microscopy
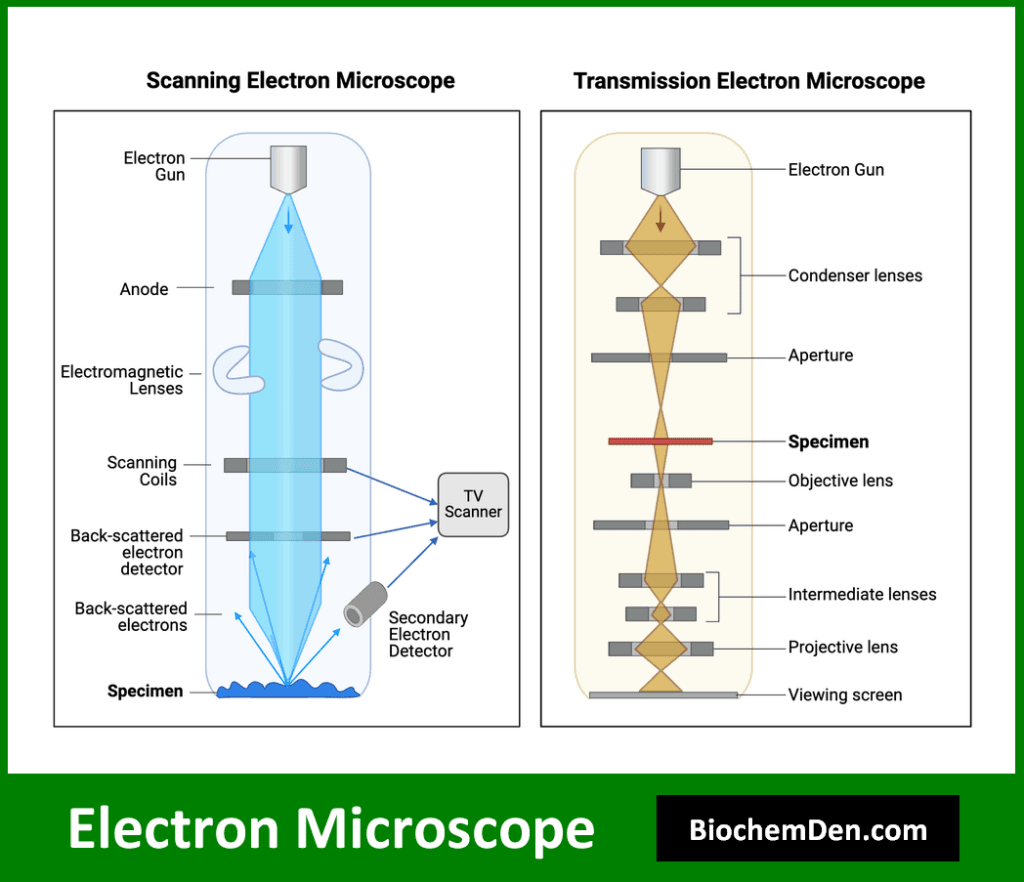
Electron microscopy uses a beam of electrons instead of light to achieve much higher resolution than light microscopy. It allows for the visualization of cellular ultrastructure and individual macromolecules.
Types of electron microscopy used in biochemistry include:
- Transmission electron microscopy (TEM) for studying internal cellular structures
- Scanning electron microscopy (SEM) for examining surface topography
- Cryo-electron microscopy for visualizing biomolecules in their native state
3. Atomic Force Microscopy (AFM)
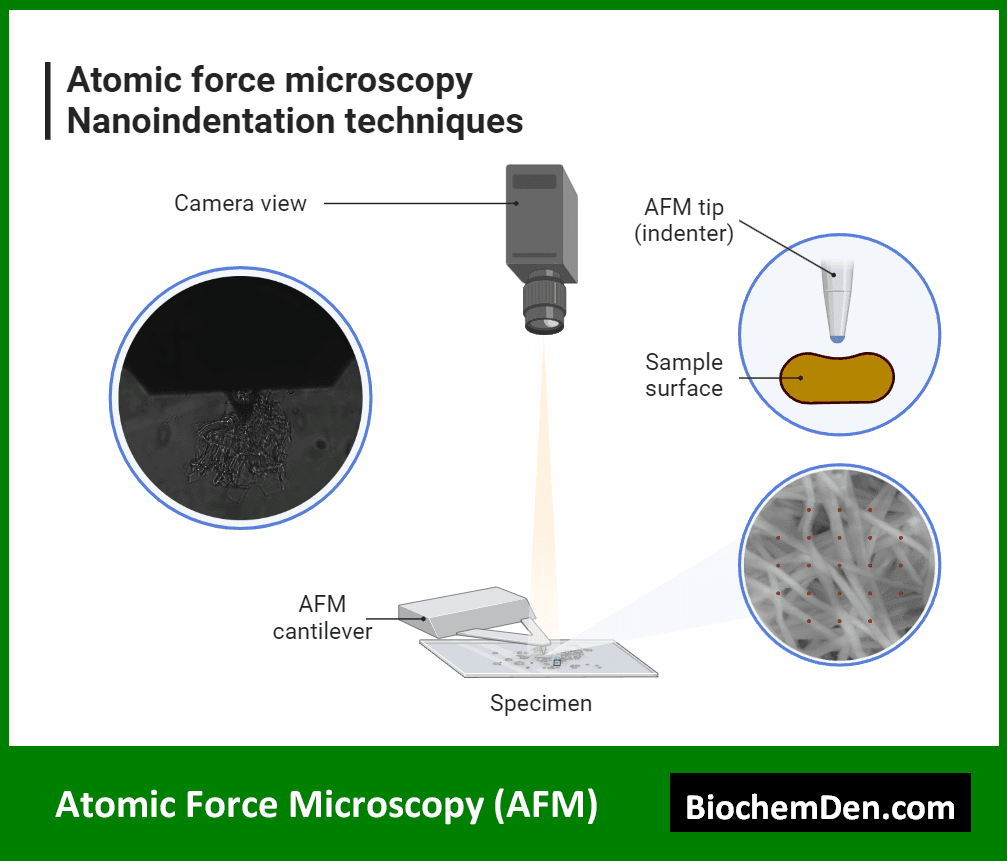
AFM is a high-resolution scanning probe microscopy technique that can achieve atomic-level resolution. It uses a tiny probe to scan the surface of a sample, providing information about its topography and physical properties.
Applications of AFM in biochemistry include:
- Studying the structure and dynamics of individual proteins
- Investigating the mechanical properties of biological membranes
- Analyzing the structure of nucleic acids and protein-DNA complexes
F. PCR and DNA Sequencing
Polymerase Chain Reaction (PCR) and DNA sequencing are fundamental techniques in molecular biology that have revolutionized genetic analysis and research.
1. Polymerase Chain Reaction (PCR)
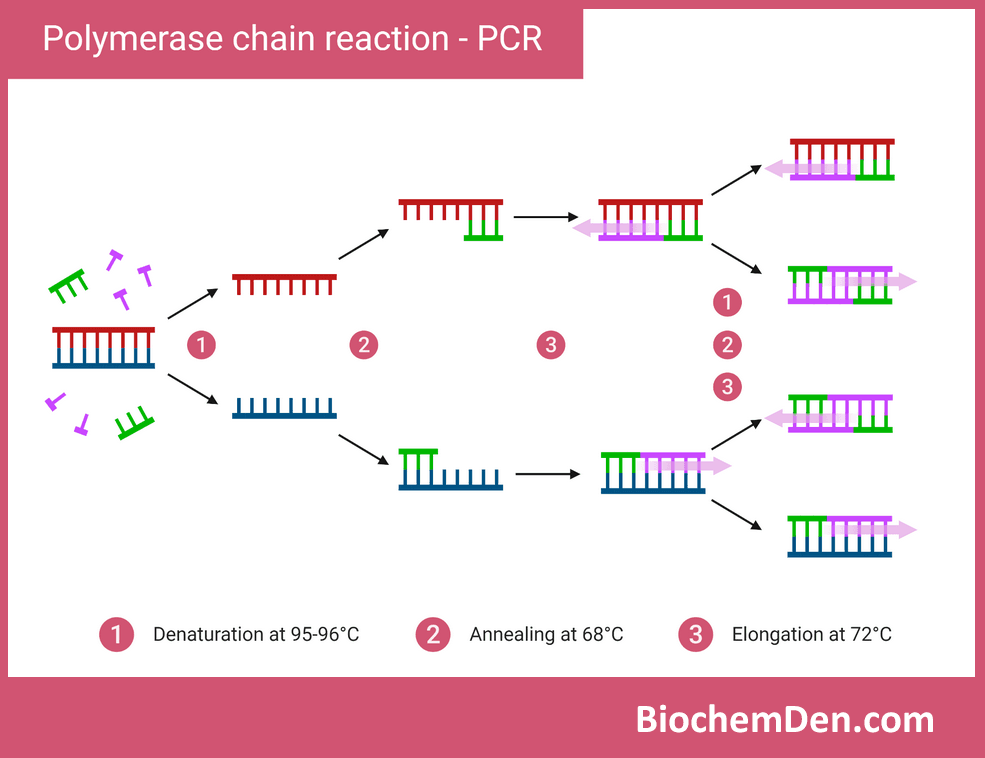
PCR is a method used to amplify specific DNA sequences, generating millions of copies from a small amount of starting material. It relies on thermal cycling and DNA polymerase to exponentially replicate target DNA.
Key applications of PCR in biochemistry and molecular biology include:
- Gene cloning and genetic engineering
- Diagnostic testing for genetic diseases and pathogens
- Forensic DNA analysis
- Studying gene expression through RT-PCR
2. DNA Sequencing
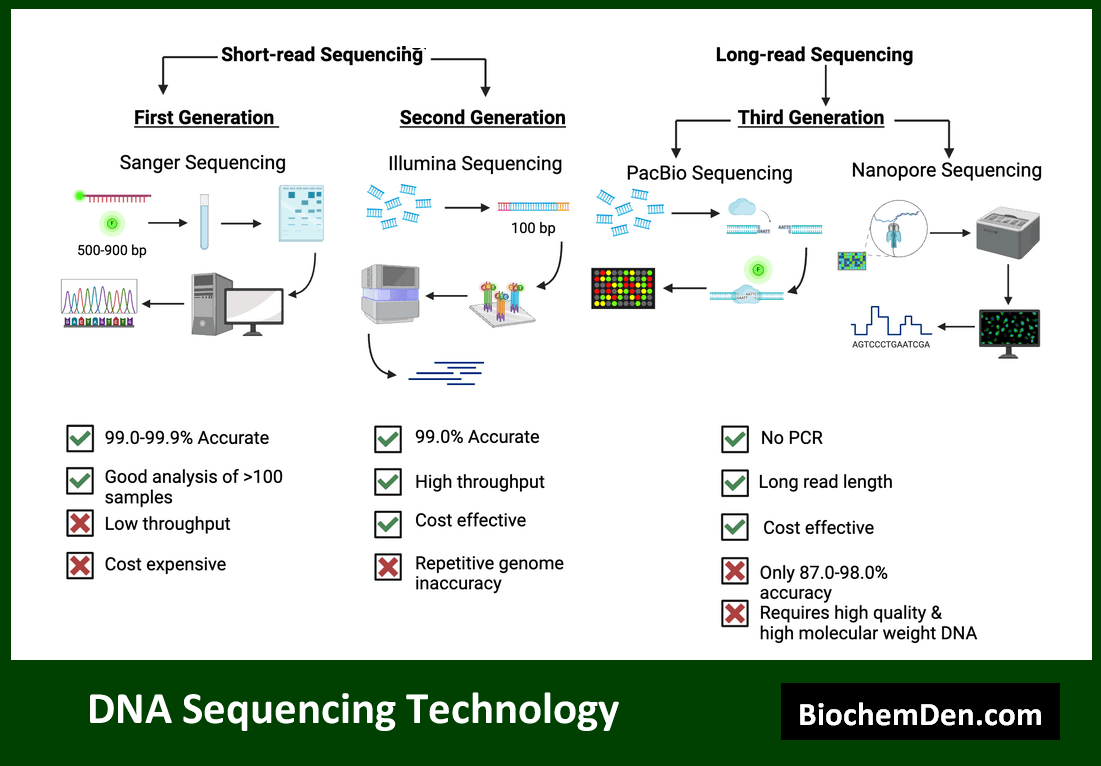
DNA sequencing techniques allow researchers to determine the precise order of nucleotides in a DNA molecule. Modern sequencing methods have dramatically increased the speed and reduced the cost of genetic analysis.
Important DNA sequencing methods include:
- Sanger sequencing, the traditional method still used for small-scale projects
- Next-generation sequencing (NGS) technologies, such as Illumina sequencing, for high-throughput applications
- Third-generation sequencing methods, like Oxford Nanopore and PacBio, for long-read sequencing
Applications of DNA sequencing in biochemistry and related fields include:
- Whole genome sequencing of organisms
- Metagenomic analysis of environmental samples
- Transcriptomics studies to analyze gene expression
- Identifying genetic variations associated with diseases
G. Protein Purification
Protein purification is a crucial process in biochemistry, allowing researchers to isolate specific proteins from complex mixtures for further study or application. Various techniques are employed, often in combination, to achieve high purity and yield.
1. Cell Lysis and Extraction
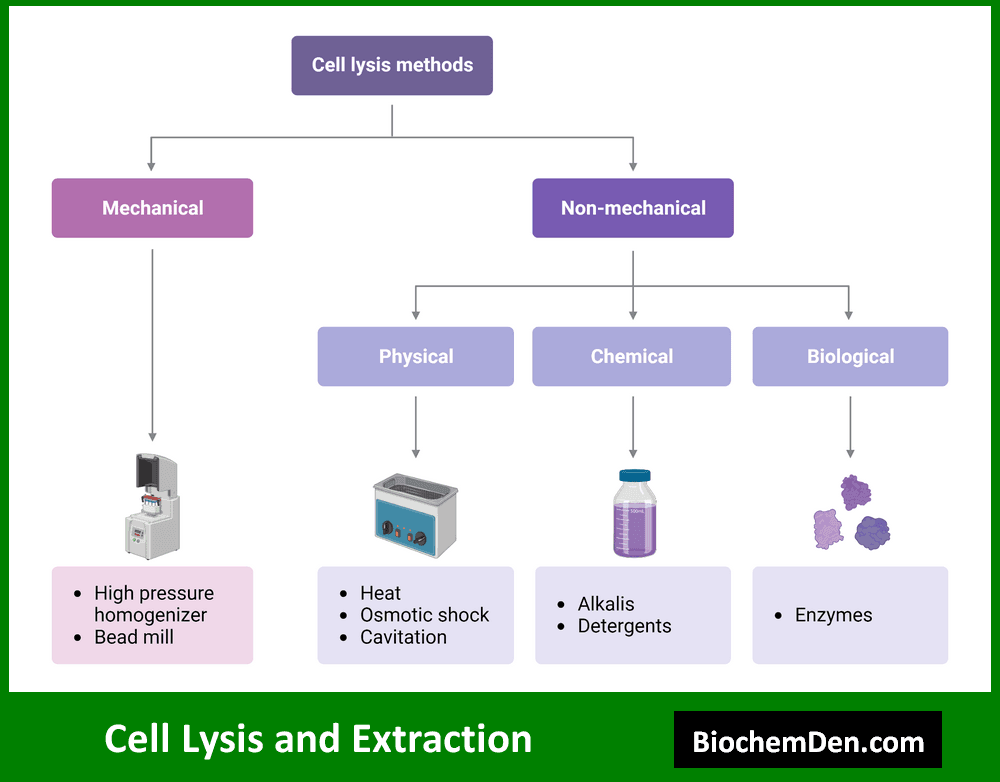
The first step in protein purification is often cell lysis, which involves breaking open cells to release their contents. Methods for cell lysis include:
- Mechanical disruption (e.g., sonication, homogenization)
- Chemical lysis using detergents or enzymes
- Freeze-thaw cycles
After lysis, the target protein must be extracted from the cellular debris. This may involve:
- Centrifugation to remove insoluble material
- Precipitation techniques to concentrate proteins
- Dialysis is used to remove small molecules and change buffer conditions
2. Column Chromatography
Various types of column chromatography are used in protein purification, each exploiting different properties of proteins:
- Ion Exchange Chromatography: Ion Exchange Chromatography (IEC) separates molecules based on their charge by using a charged resin.
- Separates proteins based on their net charge
- Uses positively charged (anion exchange) or negatively charged (cation exchange) resins
- Size Exclusion Chromatography: Size Exclusion Chromatography (SEC) sorts molecules according to their size, with larger molecules eluting first due to their inability to enter the pores of the stationary phase.
- Also known as gel filtration
- Separates proteins based on their size and shape
- Hydrophobic Interaction Chromatography: Hydrophobic Interaction Chromatography (HIC) relies on hydrophobic interactions between the molecules and the hydrophobic groups on the resin to achieve separation.
- Separates proteins based on their hydrophobicity
- Useful for purifying membrane proteins
- Affinity Chromatography: Affinity Chromatography (AC) uses specific binding interactions between a target molecule and a ligand attached to the resin to isolate highly specific molecules.
- highly specific method based on the binding affinity between the target protein and a ligand
- Examples include His-tag purification and immunoaffinity chromatography
3. Electrophoretic Techniques
Electrophoretic methods can be used both analytically and preparative in protein purification:
Preparative Gel Electrophoresis
Preparative Gel Electrophoresis is a technique used to separate and purify large quantities of DNA, RNA, or proteins. It involves applying an electric field to a gel matrix, causing molecules to migrate based on their size and charge. This method is particularly useful for isolating specific fragments (protein bands) for further analysis or experimentation.
Isoelectric Focusing
Isoelectric Focusing (IEF) is a technique that separates proteins based on their isoelectric points (pI). In an electric field within a pH gradient, proteins migrate until they reach a point where their net charge is zero. This method is highly precise for analyzing complex protein mixtures and is often used in proteomics.
- Preparative gel electrophoresis )for isolating specific protein bands):
- Isoelectric focusing for separating proteins based on their isoelectric point
4. Ultrafiltration and Dialysis
These techniques are often used in the final stages of protein purification:
- Ultrafiltration concentrates protein solutions using membranes with specific molecular weight cut-offs
- Dialysis removes small molecules and exchanges buffers
H. Enzyme Assays
Enzyme assays are crucial for studying enzyme kinetics, determining enzyme activity, and investigating the effects of inhibitors or activators. Various types of assays are used depending on the enzyme and the information sought.
1. Spectrophotometric Assays
Spectrophotometric assays are widely used due to their simplicity and ability to provide real-time measurements. They typically involve monitoring the formation of a product or consumption of a substrate that absorbs light at a specific wavelength.
Examples of spectrophotometric enzyme assays include:
- Measuring the activity of lactate dehydrogenase by monitoring NADH oxidation
- Assaying proteases using colorimetric substrates
2. Fluorometric Assays
Fluorometric assays offer higher sensitivity than spectrophotometric methods. They involve measuring the fluorescence of a product formed by the enzyme reaction or a fluorescent substrate analog.
Applications of fluorometric enzyme assays include:
- Detecting low levels of enzyme activity in biological samples
- High-throughput screening of enzyme inhibitors
3. Radiometric Assays
Radiometric assays use radioactively labeled substrates to measure enzyme activity. While highly sensitive, these assays require special handling and disposal procedures.
Key applications of radiometric enzyme assays include:
- Studying enzymes with very low activity
- Investigating enzyme-catalyzed reactions that don’t produce easily detectable products
4. Coupled Enzyme Assays
Coupled enzyme assays involve using a secondary enzyme reaction to detect the product of the primary enzyme being studied. This approach is useful when the primary enzyme’s reaction doesn’t produce an easily measurable product.
Examples of coupled enzyme assays include:
- The hexokinase/glucose-6-phosphate dehydrogenase coupled assay for measuring ATP
- Pyruvate kinase/lactate dehydrogenase coupled assay for measuring ADP
5. Discontinuous Assays
Discontinuous assays involve stopping the enzyme reaction at various time points and measuring the amount of product formed. These assays are useful when continuous measurements are not possible.
Applications of discontinuous assays include:
- Measuring the activity of enzymes with unstable products
- Studying enzyme kinetics over extended periods
I. Immunological Techniques
Immunological techniques leverage the specificity of antibody-antigen interactions to detect, quantify, and isolate specific proteins or other biomolecules. These methods are widely used in biochemistry, molecular biology, and clinical diagnostics.
1. Enzyme-Linked Immunosorbent Assay (ELISA)
ELISA is a sensitive and versatile technique used to detect and quantify specific proteins in complex mixtures. It involves immobilizing either an antigen or antibody on a solid surface and using enzyme-linked antibodies for detection.
Types of ELISA include:
- Direct ELISA
- Indirect ELISA
- Sandwich ELISA
- Competitive ELISA
Applications of ELISA in biochemistry and related fields include:
- Quantifying cytokines and other signaling molecules
- Detecting antibodies in serum for disease diagnosis
- Screening for biomarkers in clinical samples
2. Western Blotting
Western blotting, also known as immunoblotting, is a powerful technique for detecting specific proteins in a complex mixture. It combines protein separation by gel electrophoresis with specific antibody detection.
Key steps in Western blotting include:
- Protein separation by SDS-PAGE
- Transfer of proteins to a membrane (usually nitrocellulose or PVDF)
- Blocking of non-specific binding sites
- Incubation with primary antibody specific to the target protein
- Incubation with enzyme-linked secondary antibody
- Detection using a chemiluminescent or colorimetric substrate
Applications of Western blotting in biochemistry include:
- Analyzing protein expression levels in different cell types or conditions
- Detecting post-translational modifications of proteins
- Studying protein-protein interactions
3. Immunoprecipitation (IP)
Immunoprecipitation is a technique used to isolate specific proteins from a complex mixture using antibodies. It can be used to purify proteins for further analysis or to study protein-protein interactions.
Key steps in immunoprecipitation include:
- Preparing cell or tissue lysate
- Incubating the lysate with specific antibodies
- Capturing the antibody-antigen complexes using protein A or G beads
- Washing to remove non-specifically bound proteins
- Eluting the bound proteins for analysis
Applications of immunoprecipitation in biochemistry include:
- Isolating protein complexes for mass spectrometry analysis
- Studying protein-protein interactions in vivo
- Investigating post-translational modifications of specific proteins
4. Flow Cytometry
Flow cytometry is a powerful technique that allows for the simultaneous measurement of multiple physical and chemical characteristics of individual cells or particles as they flow in a fluid stream through a beam of light.
Key features of flow cytometry include:
- Ability to analyze multiple parameters simultaneously
- High-speed analysis of large numbers of cells
- Capability to sort cells based on specific characteristics
Applications of flow cytometry in biochemistry and related fields include:
- Analyzing cell populations in complex mixtures
- Studying cell cycle progression and apoptosis
- Detecting and quantifying specific proteins using fluorescent antibodies
- Sorting cells for further analysis or culture
5. Immunohistochemistry (IHC) and Immunofluorescence (IF)
These techniques use antibodies to detect specific proteins in tissue sections (IHC) or cells (IF). They provide valuable information about protein localization and expression patterns in situ.
Key steps in IHC and IF include:
- Sample preparation (fixation and sectioning for tissues, or fixation for cultured cells)
- Antigen retrieval (for some samples)
- Blocking of non-specific binding sites
- Incubation with primary antibody
- Incubation with labeled secondary antibody
- Detection and visualization (using a microscope)
Applications of IHC and IF in biochemistry and related fields include:
- Studying protein localization within cells or tissues
- Analyzing changes in protein expression during development or disease
- Identifying specific cell types in complex tissues
Final words about Biochemical Techniques basics
Biochemical techniques form the foundation of modern biological research, enabling scientists to explore the molecular basis of life with unprecedented detail and precision. From the basic principles of spectroscopy and chromatography to the complex applications of immunological techniques and DNA sequencing, these methods have revolutionized our understanding of biological systems.
As we’ve explored in this comprehensive guide, each technique offers unique insights into different aspects of biological molecules and processes:
- Spectroscopy provides valuable information about molecular structure and interactions.
- Chromatography allows for the separation and purification of complex mixtures.
- Electrophoresis enables the analysis of proteins and nucleic acids based on size and charge.
- Centrifugation separates cellular components and macromolecules based on their physical properties.
- Microscopy techniques reveal the structure and organization of cells and biomolecules at various scales.
- PCR and DNA sequencing have transformed genetic analysis and molecular biology.
- Protein purification techniques are crucial for isolating and studying individual proteins.
- Enzyme assays allow for the characterization of enzyme activity and kinetics.
- Immunological techniques leverage the specificity of antibodies for detecting and analyzing proteins in complex biological samples.
Mastering these techniques is essential for anyone pursuing a career in biochemistry, molecular biology, or related fields. However, it’s important to note that the field of biochemical techniques is continually evolving, with new methods and technologies emerging regularly. Researchers must stay up-to-date with the latest advancements to take full advantage of the tools available for their studies.
Furthermore, while each technique has its strengths, many research questions require the integration of multiple methods to gain a comprehensive understanding of biological systems. For example, a study investigating a newly discovered protein might employ spectroscopy to analyze its structure, chromatography for purification, enzyme assays to determine its function, and immunological techniques to study its expression and interactions in cells.
As we look to the future, emerging technologies such as single-cell analysis, CRISPR-based techniques, and advanced imaging methods promise to further expand our toolkit for biological research. These new approaches, combined with the fundamental techniques discussed in this guide, will continue to drive discoveries in biochemistry and related fields, advancing our understanding of life at the molecular level and paving the way for new applications in medicine, biotechnology, and beyond.
In conclusion, a solid grasp of biochemical techniques is indispensable for anyone seeking to unravel the complexities of biological systems. By providing researchers with the tools to isolate, analyze, and manipulate biomolecules, these methods serve as the cornerstone of modern life sciences research, enabling us to probe deeper into the fundamental processes that underlie all living organisms.
Discover more from Biochemistry Den
Subscribe to get the latest posts sent to your email.